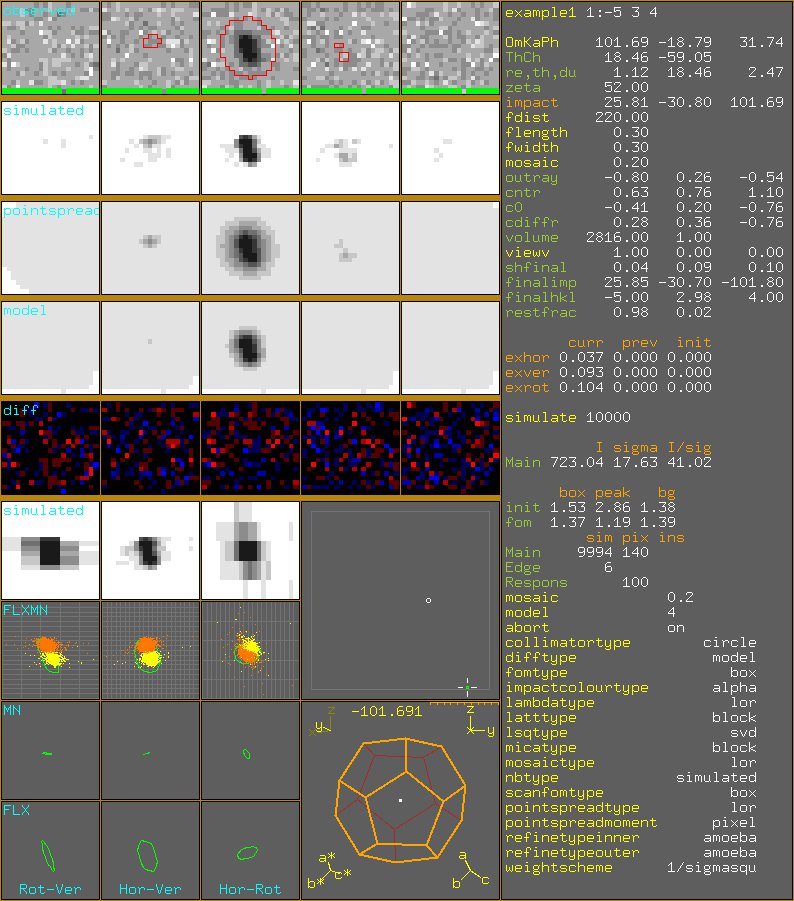
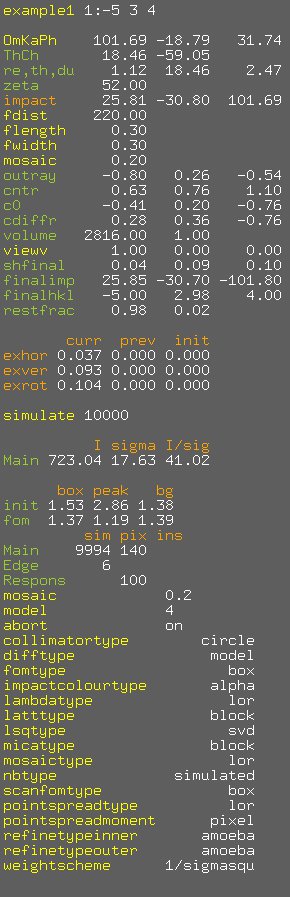
In the right window (the legenda-window) you will find some parameters describing the current simulation.
Next to the legenda-window, two windows are shown: the top window is the detector-window, the second window displays the xtal.
Next to the detector- and xtal-windows, a 3*4 matrix of 12 windows has the following layout:
The upper left of the main-window consists of up to 5 rows, used to display slice information. The contents of these rows are controlled by link.
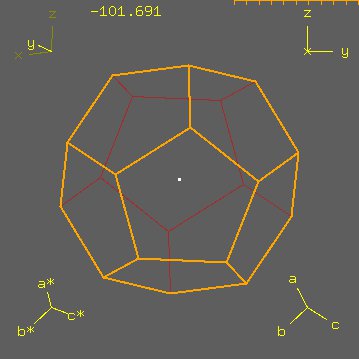 In the very top right, a ruler is plotted. The total length
of the ruler is 0.1 mm. The distance between 2 ticks is 0.01 mm.
In the very top right, a ruler is plotted. The total length
of the ruler is 0.1 mm. The distance between 2 ticks is 0.01 mm.
| command | value | description |
|---|---|---|
| view | z | set view direction |
| viewrot | 0.0 | view along view direction, then rotate around vertical axis |
| xtalplot axes | on | plot unit cell axes (lower left and lower right) |
| xtalplot corner | off | plot xtal corner numbers |
| xtalplot cvector | off | plot cvector in lab system |
| xtalplot face | off | plot face numbers |
| xtalplot gonio | on | plot goniostat system (upper left) |
| xtalplot lab | on | plot laboratory system (upper right) |
| xtalplot ruler | on | plot ruler (top upper right) |
| colour facesbg | brown | obscured faces |
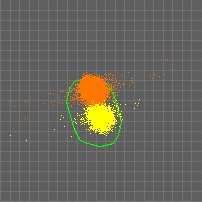
| colour facesfg | orange | visible faces, ruler |
| colour axesbg | yellow4 | axes pointing down |
| colour axesfg | yellow | axes pointing forward |
| colour fg | white | corners, origin |
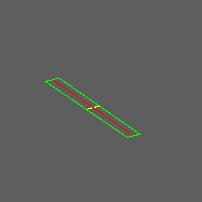
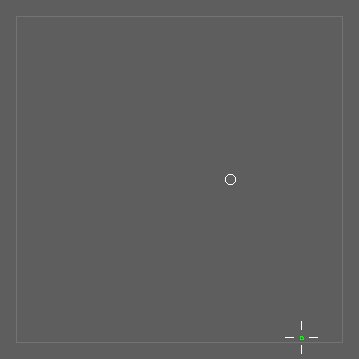 Commands related to the detector-window
| command | value | description |
|---|---|---|
| dethor | 68 | detector horizontal size |
| detver | 62 | detector vertical size |
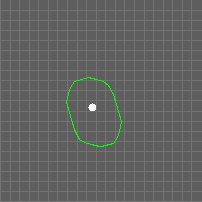
| colour grid | grey45 | colour of box |
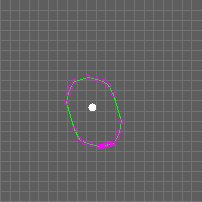
| colour fg | white | colour of primary beam impact |
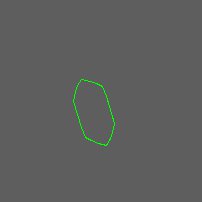
| colour contour | green | contour colour |
| colour incomplete | red | imcomplete contour colour |
| colour name | default value | description |
|---|---|---|
| legenda1 | yellow | set by operator |
| legenda2 | yellowgreen | calculated value |
| legenda3 | orange | refined parameter |
| legenda4 | red | warning or error |
| label | description | legenda | displayed if |
|---|---|---|---|
| 'boxfilename' | reflection number, reflection indices | ||
| OmKaPh OmChPh |
goniostat angles | goniostat | |
| re,th,du | resolution, theta, duration | ||
| zeta | resulting zeta | cvector | |
| impbox | hor ver rot | calculated position differs from box data | |
| impact | hor ver rot | ||
| fdist | focus dist | focus | |
| flength | focus length | focus | |
| fwidth | focus width | focus | |
| mosaic | isotropic mosaicity [weight] | mosaic | |
| mosax | mosaic rot axis | mosaic | mosaicrotangle≠0 |
| mosang | mosaic rot angle | mosaic | mosaicrotangle≠0 |
| animo | anisotropic mosaicity | mosaic | animo>0.0 |
| anivec | anisotropic vector | mosaic | animo>0.0 |
| mica | mica contribution | mosaic | mica>0.0 |
| micavec | mica vector | mosaic | mica>0.0 |
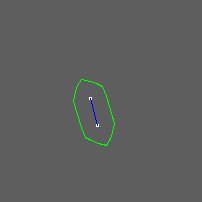
| outray | diffracted beam | outray | |
| cntr | contour dimensions | contour | |
| c0 | cvector at zero rot | cvector | |
| cdiffr | cvector at diffractiong position | cvector | |
| xtalAx | crystal rotation axis | xrot | xrot>0.0 |
| xrot | crystal rotation | xrot | xrot>0.0 |
| volume | crystal volume, volume fraction | ||
| viewv | view vector | view | |
| viewr | view rotation | view | viewrot≠0.0 |
| shinit | initial shift | ≠0.0 | |
| shextra | extra shift | ≠0.0 | |
| shfinal | shinit + shextra | ≠0.0 | |
| finalimp | impact + shfinal | shfinal ≠0.0 | |
| finalhkl | reflection indices of finalimp | shfinal ≠0.0 | |
| restfrac | fraction of impacts central/other frame(s) | ||
| refined variables | |||
| variable | current previous initial | refine | |
| Simulation | |||
| simulate | nr of simulations | simulate | |
| msa1 | msa1 | simulate | >0.0 |
| msa2 | msa2 | simulate | >0.0 |
| reject | reject | simulate | >0.0 |
| globalbg | global background | simulate | lsqtype=svdnobg or svdnoc |
| 'varname' | simulate, changed | non-default process variables, markdefault | |
| 'string varname' | fomtype | simulate,changed=off,full | |
| Intensities | |||
| Main | Intensity Sigma Intensity/Sigma | main reflection | |
| SUM1 | Intensity Sigma Intensity/Sigma | sum of Main and Neighbour1 | |
| Nb1 | Intensity Sigma Intensity/Sigma | Neighbour1 | |
| Figure of merit | |||
| init | box peak bg | ||
| fom | box peak bg | ||
| counts of simulations, pixels, pixels within main | |||
| Main | main reflection | simulate>0 | |
| Single | not-overlapping within main | simulate>0 and pixMain≠pixSingle | |
| Overlap | overlapping | simulate>0 and sim≠0 or pix≠0 | |
| Edge | beside shoebox | simulate>0 and sim≠0 | |
| Reject | rejected | simulate>0 and sim≠0 or pix≠0 | |
| overflow | overdflow | simulate>0 and sim≠0 or pix≠0 | |
| respons | bad respons | simulate>0 and sim≠0 or pix≠0 | |
| incomplete | not all impacts contribute to contour | ≠0 | |
 |
 |
 |
 |
 |
| default | impact l on contour l on |
impact x on contour x on |
impact f on contour f on |
impact flx on |
 |
 |
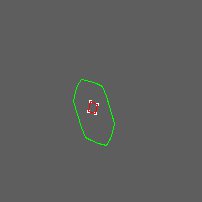
| default | micavec 0 0 1 mica 0.1 contour m on contour n on |
 |
 |
 |
 |
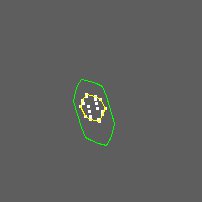
| default | draw contourpoints on | impact flxmn on | simulate 10000 |
 |
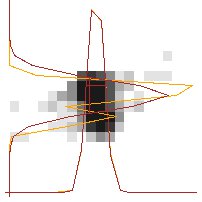 |
| simulate 10000 | simulate 10000 draw profilehor on draw profilever on |
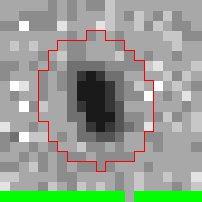 |
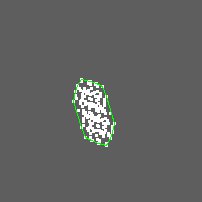
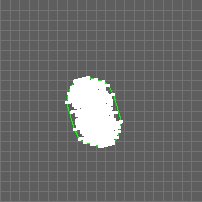
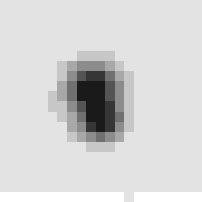
Row 1: observed The red line is drawn at the cutoff boundary. The green pixels indicate a bad respons. link observed 1 1 pixel link respons 1 1 fill link overflow 1 1 fill link reject1 1 1 box link reject2 1 1 box link pointspread 2 1 outline |
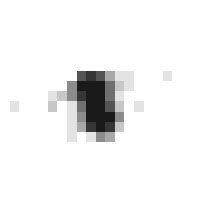 |
Row 2: simulated. The contents of row 2 are also summed into the projection-window link simulated 1 2 pixel |
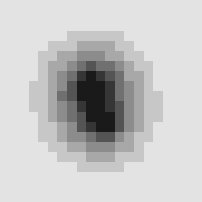 |
Row 3: Pointspread added to row 2 pointspreadtype lor pointspreadgamma 0.8 link pointspread 1 3 pixel |
 |
Row 4: the modellink model 1 4 pixel |
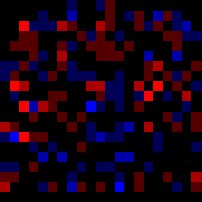 |
Row 5: The difference between observed (row 1) and model (row 4) divided by sigma. Red: model > observed. Blue: model < observed. difftype model. (use σmodel) diffscale 1.0 (colourchanges at Δ/σ, 2Δ/σ, 3Δ/σ) link diff1 5 pixel |